
Better maintenance directly cuts energy costs by 16.5%
It really is as simple as that. Here’s our simple model that demonstrates those savings. At BuiltSpace, we help facilities operators manage assets & services, to improve operational and energy efficiencies, and measure their own portfolio-wide results in real-time.
About the model
Derived from the best available published research from the US Dept of Energy, Oak Ridge National Labs, and the University of British Columbia, BuiltSpace has constructed a cost/condition model for a typical 10 year old packaged rooftop unit, with expected annual maintenance and energy costs.
| Maintenance Interval (Days) | 90 | 110 | 130 | 180 | 270 | 385 |
| Equipment Condition | Excellent | Good | Fair | Poor | Very Poor | Negligent |
| Life Expectancy (years) | 21 | 20 | 17 | 14 | 13 | 11 |
| Annual Energy $ – fans | $ 459 | $ 527 | $ 563 | $ 665 | $ 991 | $ 1,643 |
| Annual Energy $ – Compressor | $ 912 | $ 960 | $ 1,152 | $ 1,344 | $ 1,536 | $ 1,718 |
| Annual Energy Cost | $ 1,371 | $ 1,487 | $ 1,715 | $ 2,009 | $ 2,527 | $ 3,361 |
| Annual Repair/Reserve Cost | $ 285 | $ 300 | $ 360 | $ 420 | $ 480 | $ 537 |
| Current Operations | ||||||
| Annual Filter Replacement Cost | $ 412 | $ 337 | $ 285 | $ 206 | $ 137 | $ 96 |
| Annual operating cost | $ 2,068 | $ 2,124 | $ 2,360 | $ 2,635 | $ 3,144 | $ 3,995 |
Methodology (References by request, provided in Excel template)
From various sources, BuiltSpace constructed a model of expected energy consumption for a typical packaged rooftop unit at various conditions of maintenance. From real-time anonymized maintenance data, we then determined expected maintenance cost data for traditional maintenance and optimized maintenance practices. We then used this data to construct a typical total daily cost chart over time. The total daily costs included the average replacement cost/days since new), and the expected energy cost to maintain airflow through the filter for the given number of days in use. Price per kWh was set at $0.12 for this example.
Model Results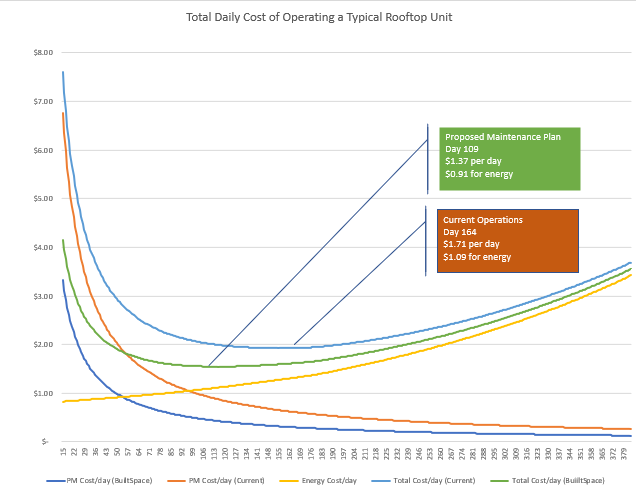
Based on the model, the baseline cost optimal time to replace air filters was on day 164, where the average daily cost was estimated at $1.71, of which $1.09 was energy cost. Using BuiltSpace, the expected cost to replace a filter (using real data) dropped by almost 50%, with an optimal replacement cycle of 109 days. Calculated total daily cost of $1.37 and $0.91 for energy.
Savings amount to 16.5% for energy, and 20% savings in operations (labour and energy).
Notice that the total repair and maintenance costs (filter replacements plus repair) change little between best and worst case maintenance scenarios. In all cases, annual maintenance costs are expected to range between $600 and $700 per year.
Real-life Results
Intuitively, we know from experience that all equipment does not operate at the same rate, yet, for efficiency, scheduled maintenance are frequently completed by bulk filter replacement. Larger facilities can have hundreds, even thousands, of filters. We have examples with over 1,100 individual filter changes per quarter. With parts and labour, costs per change are in the $40-$100 range.
With traditional maintenance, service records are often limited to closed work orders. Individual service interventions are not documented, making implementation of “change it when required” impossible.
BuiltSpace enables detailed change management, with real-time documentation of each service, as the technician steps away from the equipment, for the first time enabling thousands of assets to be effectively managed, at much lower cost. Customers have documented per unit cost savings of 50-70%, exceeding model projections. Now with accurate service intervals, these same customers can get very close to model energy saving outcomes. At the same time, in many facilities, we suspect that the (current operations) baseline “average days in use” may be significantly longer, and energy costs significantly higher than estimated by the model.
If you would like to obtain a working copy of this maintenance model (Excel spreadsheet) for you own use, please complete the request form below, or start a chat on this site.
Rick@builtspace.com